Modules · For the quality manager
Metrics, analysis, and improvement
How the work moves
Improvement loop- 1Collect data
- 2Read the trend
- 3Choose action
- 4Check the result
Open: More > Metrics, Analysis & Improvement. Typical leads: Quality Manager and Executive. Purpose: retain quantitative observations and the analysis used to improve the system.
Set up a metric
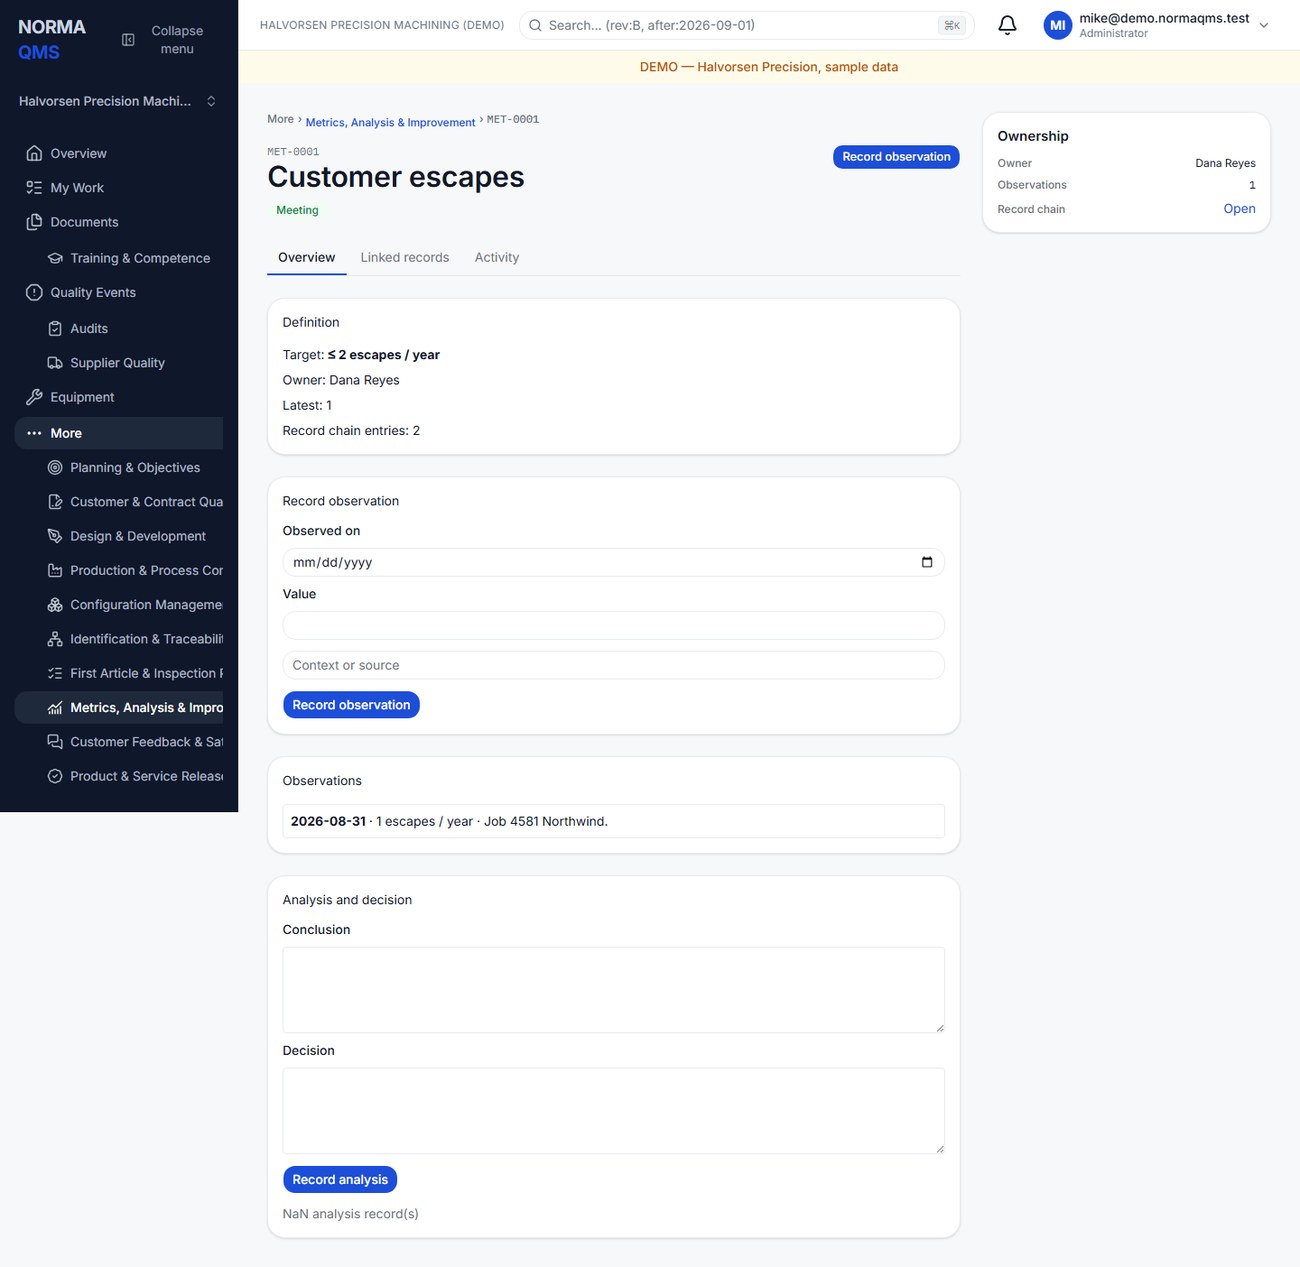
Create a metric with name, unit, target, direction, and owner. Make the measurement definition clear in the available descriptive fields or analysis. Choose At least for a lower bound and At most for an upper bound. Norma assigns a MET reference.
Useful shop metrics may include first-pass yield, scrap rate, on-time delivery, or customer returns. Pick measures you can populate consistently from actual records. The app does not automatically become the source of every manufacturing or financial number.
Observe and analyze
- Open the metric and record a dated observation with its value and available note.
- Check that units and measurement basis match earlier observations. For a percentage, be consistent about numerator and denominator.
- Review the derived Meeting, Off track, or Unmeasured result.
- Record analysis explaining the trend, significance, and planned follow-up. Analysis becomes part of the chain.
- Take corrective or improvement action in the appropriate source module, or create an action item and include the MET reference.
The latest relevant observation determines the displayed state. A backdated value is historical evidence and should not be expected to replace a more recent observation's status. An unmeasured metric is not a passing metric.
Metrics versus objectives
An objective records a performance commitment and its monitored progress in Planning & Objectives. A metric is a maintained measure with observations and analysis. They can describe related performance, but they are separate records. Establish who updates each to avoid contradictory numbers in the same management review.
Example analysis: “First-pass yield fell from 98% to 94% in August. Seven rejects were associated with fixture F-12. NC-0018 and CAPA-0004 address that cause; compare the next three lots after implementation.” This connects the number to evidence and follow-up without pretending that the chart itself fixes the process.
Completion check: the value, date, unit, direction, target, and analysis are correct, and follow-up can be traced to a person or record.
In the user guide
This article is chapter 27, "Metrics Analysis and Improvement", of the NormaQMS User Guide (NORMA-UG-001), which is under Help > User guide. Chapter numbers in the text refer to that guide.